Architecture Overview
Enterprise Virtual Environment
A comprehensive breakdown of my multi-VM infrastructure and live SIEM pipeline

To start things off, here is a screenshot that displays the VirtualBox manager. The architecture that I have designed consists of a custom NAT network, which safely routes traffic between four primary machines. These machines include a centralized Ubuntu-based SIEM, a primary Windows Server, a Windows 11 endpoint, and a Linux-based, vulnerable web application. This enterprise-grade environment hosting an integrative assortment of systems facilitates real-time defensive telemetry for effective security monitoring as well as coordinated response.
I installed the Splunk Universal Forwarder on to each one of my endpoints. This allows me to manage and configure the input and output files accordingly and conduct constant, effective monitoring within the Splunk interface as well. This data pipeline dictates the routing of native Windows Security logs, Sysmon operational telemetry, and Auditd telemetry, ensuring the data lands directly into the centralized Ubuntu SIEM for real-time indexing and analysis.


Here is a screenshot of the input file located on my Domain Controller. This configuration explicitly commands the Universal Forwarder to monitor core Windows Event Logs (Security, System, and Application) alongside dedicated Microsoft Sysmon telemetry. Also, by controlling the ingestion at the endpoint level, the architecture reduces unnecessary log noise and optimizes search performance for the centralized indexer.
To protect the integrity of the data pipeline, I implemented System Access Control Lists (SACLs) directly on the Splunk Universal Forwarder configuration files. This forces the Windows endpoint to generate a high-priority Event 4663 alert if any user or process attempts to tamper with, modify, or delete the logging parameters. This ensures that any attempt to blind the SIEM is immediately recorded and flagged.

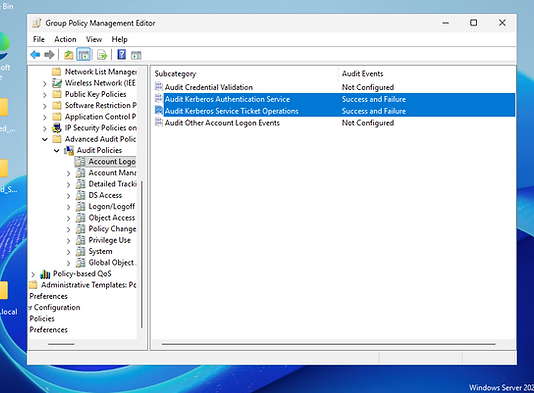
To establish a robust detection posture across the network, I configured advanced Group Policy Objects (GPOs) from the primary Domain Controller. By strictly enforcing 'Success and Failure' auditing for both Kerberos Authentication and Service Ticket Operations, the domain automatically generates critical security telemetry (such as Event IDs 4768 and 4769). This centralized policy ensures that all authentication attempts and potential lateral movement across the network are permanently logged and primed for SIEM ingestion.

Utilizing the Splunk Search & Reporting interface, I crafted targeted queries to isolate specific endpoint telemetry. By applying the machine name filter Win-Target02, the search effectively cuts through domain noise to return precise Kerberos authentication events generated by that exact endpoint. Expanding the indexed logs reveals the granular details of the Kerberos ticketing process. The capture of Event ID 4769 confirms that a Kerberos service ticket was successfully requested by the endpoint.


Next, I wanted to conduct a robust vulnerability assessment. I deployed the Greenbone Vulnerability Management (GVM) suite using Docker Compose. The command sudo docker-compose up -d successfully initialized all required microservices, ensuring a stable environment for subsequent scanning.

I explicitly and intentionally misconfigured a few common, well-known services. The easily identifiable services include openssh, telnet, ftp, and snmp. I intentionally misconfigured them so that my OpenVAS vulnerability scan would deliberately and quickly recognize the insecure attack surface of my network. I wanted to provide actionable results in my scan, as opposed to a low-risk grading. Most of the misconfigurations are easily reversible, and the entire process is being conducted on my privately established NAT network, to ensure that these temporary follies do not pose any real threat to my personal infrastructure.


As evidenced by the results, the OpenVAS scan successfully identified the insecure services that I deliberately introduced. This highlights the critical importance of regular, automated vulnerability scans. SNMP is rated as severe due to the default community strings present in the configuration file above. This could allow an attacker to perform reconnaissance by querying system information, running processes, and network connections.


Next, I installed impacket to demonstrate how an attacker performs a credential dump. This a common vector that gets exploited after an attacker uses reconnaissance tactics to gather information about your network. The script ~/.local/bin/secretsdump.py was directed against my domain controller, and as you can see sensitive password hashes and kerberos keys were made available in the Linux terminal of the attacking machine.


Additionally, I ensured that my Splunk Forwarder was properly configured so that the necessary event data needed to detect the attack was logged accordingly. The images of the Splunk user interface display a rapid succession of events 5156 and 4663, which could be a potential indicator of malicious activity. Event ID 5156 means that the Windows Filtering Platform has allowed a connection to proceed either inbound or outbound, and 4663 means an object was accessed.


To demonstrate a complete adversary lifecycle, I simulated a basic post-compromise scenario following a successful credential extraction. Leveraging the compromised administrator account, I executed a Living-off-the-Land (LotL) technique to establish persistence on the target machine. This included native PowerShell commands that were used to inject a malicious payload into the HKCU\...\Run registry key.
I structured the payload with -WindowStyle Hidden and a sleep timer to guarantee that the simulated backdoor will silently execute in the background every time the account authenticates, allowing the attacker to survive system reboots undetected.
After rebooting the system and opening the Task Manager, an unknown PowerShell instance is visible and running


When the command line column is expanded, the same PowerShell script used to infect the Registry run key is displayed.

To hunt for Living-off-the-Land activity, I used Get-CimInstance to query the Win32_Process class and extract the exact command-line execution strings for all running PowerShell instances.
As exposed in the output, two distinct sessions are running under the same user space. PID 1772 represents my benign, administrative PowerShell instance, while PID 5164 reveals the hidden persistence mechanism actively executing the -WindowsStyle Hidden sleep command.
To uncover the artifact, I bypassed graphical tools like regedit.exe and utilized Invoke-CimMethod to query the static StdRegProv WMI class. This allowed me to extract a complete list of values from the target HKCU\...\Run registry hive and successfully identify the hidden PortfolioSim registry key responsible for launching the attack.


Finally, I wanted to demonstrate effective security monitoring at the application-level. I installed OWASP's intentionally vulnerable Juice Shop application on my Linux desktop virtual machine. I configured it with the Nginx reverse proxy, that way I could target the backend API directly with canonicalized URL attacks.


Next, I installed the Zap penetration tester and examined Juice Shop. This enabled me to analyze certain parameters pertaining to classic attack vectors such as SQLi, XSS, SSRF, etc. While Juice Shop is a single page application, the lack of server-side input validation and parameterized queries allows malicious actors to bypass client-side restrictions and execute destructive commands directly against the backend database. You can see from the results of the test that the script '( is a permissible form of input, and could lead to a potential SQLi.
To finish things off, I constructed a Web Attack Payload Panel under the Splunk Dashboards section for my Linux desktop virtual machine. It utilizes a highly specific and developed SPL string to identify and record advanced forms of SQLi, XSS, SSRF, Command Injection, and Directory Traversal. The rest of the dashboards can be viewed under the Splunk Panels page on the menu.
The canonicalized URLs that I used to trigger SQLi and XSS events under this panel are as follows:
-For XSS:
http://192.168.10.40/rest/products/search?q=%3Ciframe%20src=%22javascript:alert('SOC%20Test')%22%3E
-For SQLi:
http://192.168.10.40/rest/products/search?q=apple'%20OR%201=1--

